MADNESS
To build MADNESS with TAU for profiling/tracing, some modifications need to be made to the code for parsing purposes. Additionally, a modification was made to fix a bug in MADNESS.
- To begin, get the source from svn:
svn co -r1177 http://m-a-d-n-e-s-s.googlecode.com/svn/local/trunk madness
- Next, patch it with the following patch:
- Build TAU with -pthread support.
- Next, make sure you have built your own blas and lapack (system installed ones will rarely work). Also, install google perftools. Configure as follow:
export TAU_MAKEFILE=</path/to/tau-stub-makefile>
export TAU_OPTIONS="-optVerbose -optKeepFiles -optNoRevert -optHeaderInst -optTauSelectFile=$HOME/apps/madness/select.tau"
MPICC=tau_cc.sh MPICXX=tau_cxx.sh ../configure --prefix=$HOME/apps/madness/install-tau LIBS="-L/usr/local/packages/lapack -llapack -lblas \
-lgfortran -L/usr/local/packages/google-perftools-1.3/lib -ltcmalloc_minimal" --disable-dependency-tracking
- Build the code
make
make install
- Run the code
export MADNESS_ROOT=$HOME/apps/madness/install-tau
export MAD_NTHREAD=7
export MRA_DATA_DIR=${MADNESS_ROOT}/share
export TAU_VERBOSE=1
export TAU_METRICS=LINUX_TIMERS
time mpiexec -n 1 ${MADNESS_ROOT}/bin/moldft
- Examine results...
Overhead of Instrumentation Methods
Of the available instrumentation options, the only viable solution we found was to use header instrumentation with a selective instrumentation file (automatically generated).
| Method | Number of Profiled Events | Runtime (seconds) | Overhead (%) |
|---|---|---|---|
| Uninstrumented | 654s | ||
| Regular Source Instrumentation | 183 | 748s | 14.4% |
| Compiler-based Instrumentation | 1321 | 19625s | 2901% |
| Source Instrumentation with headers (-optHeaderInst) | 806 | 1628s | 150% |
| -optHeaderInst and selective instrumentation (auto) | 539 | 685s | 4.7% |
Discussion of Overhead
The use of non-header instrumentation would have an acceptable overhead if selective instrumentation is used. However, the majority of executable code (by time) for MADNESS is contained in the headers. These events are not instrumented, and hence the time/counters spent in them is attributed to the currently instrumented event. In the case of MADNESS, for any thread other than thread 0, this is the "ThreadBase::main" that we added in the patch. For thread 0, the story is similar.
We investigated the use of compiler-based instrumentation for MADNESS merely for completeness sake since using compiler instrumentation on a C++ code with heavy use of templates, STL, or getters/setters is bound to result in excessive overhead. Indeed, we see that the overhead is in thousands of percent. We can perform selective instrumentation on a file by file basis, but we have no automated way to do this.
To properly instrument MADNESS, we need to use TAU's header instrumentation facility, which is enabled by setting -optHeaderInst in the $TAU_OPTIONS variable while compiling the code. Without selective instrumentation, the overhead is quite large, 150%, due to the large number of small one line routines (getters/setters, etc) that are called hundreds of millions of times. To automatically eliminate these routines, we simply run it once with full instrumentation, and then use the TAU tools (either tau_reduce, or paraprof) to automatically generate a selective instrumentation file. Once generated, we recompile the code and run it again and we see that we have a 4.7% overhead.
Flat Profile Performance Data
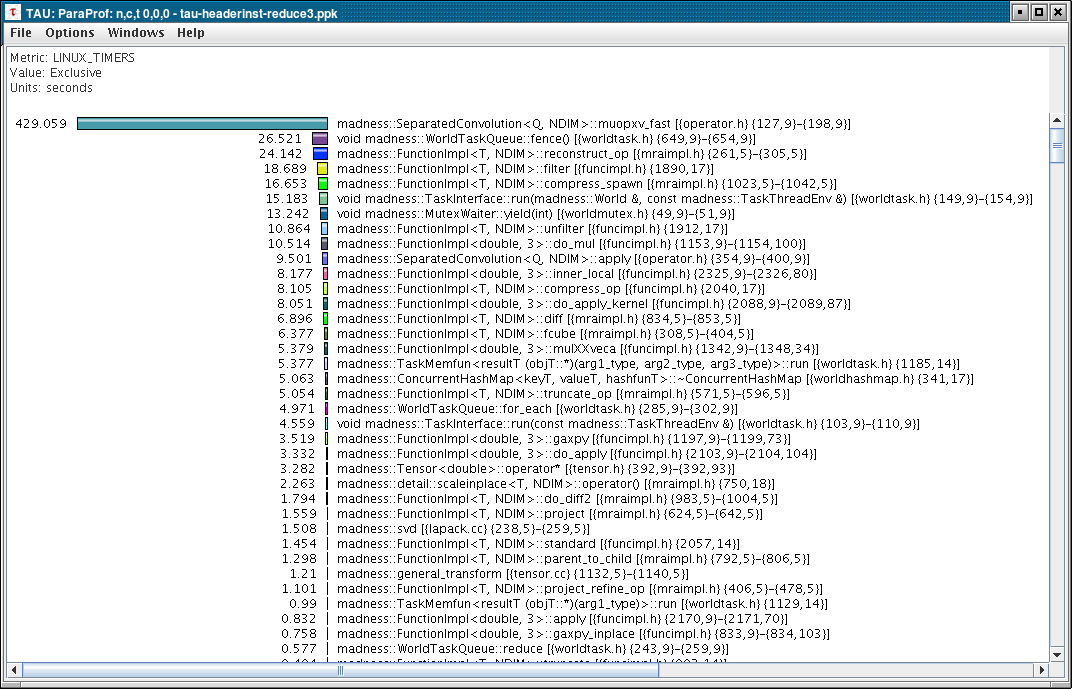
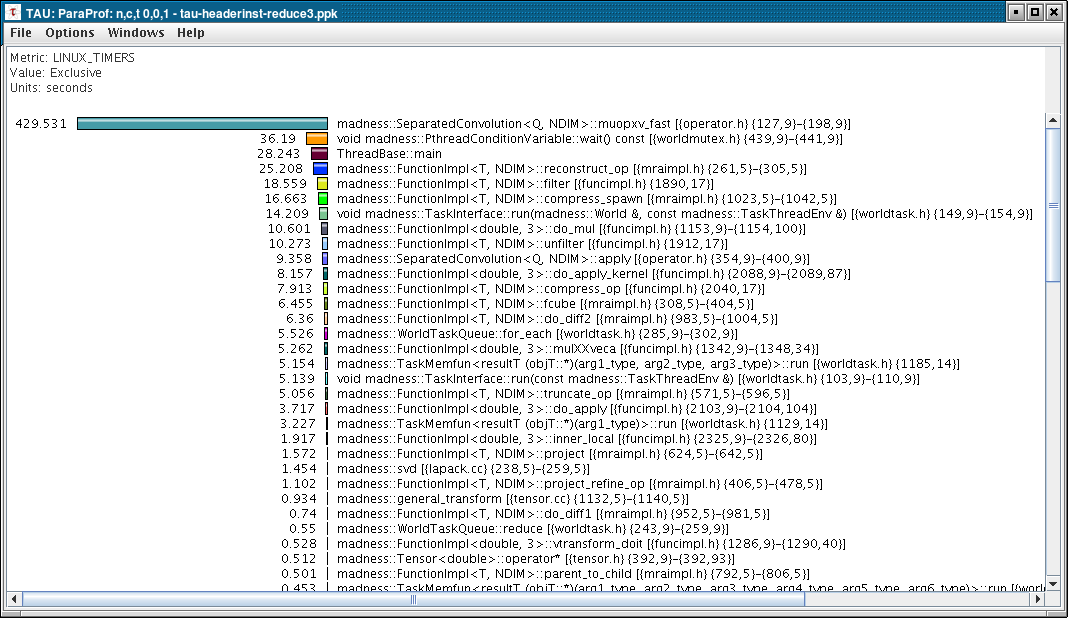
Shown below are the flat profiles for thread 0 and thread 1:
The remaining threads look very similar to thread 1:
So, the majority of the time (62%) is spent in madness::SeparatedConvolution<Q, NDIM>::muopxv_fast [{operator.h} {127,9}-{198,9}]

